AI/ML engineering · Agriculture
Crop disease detection and yield prediction
We build crop disease detection and yield prediction for agricultural enterprises: diagnosis from field photographs with severity scoring, yield models that combine satellite imagery, weather, soil and management data, validation against agronomists' judgement and harvest results, and inference that runs on a phone without a signal. Advisers confirm diagnoses, and the models and code are yours.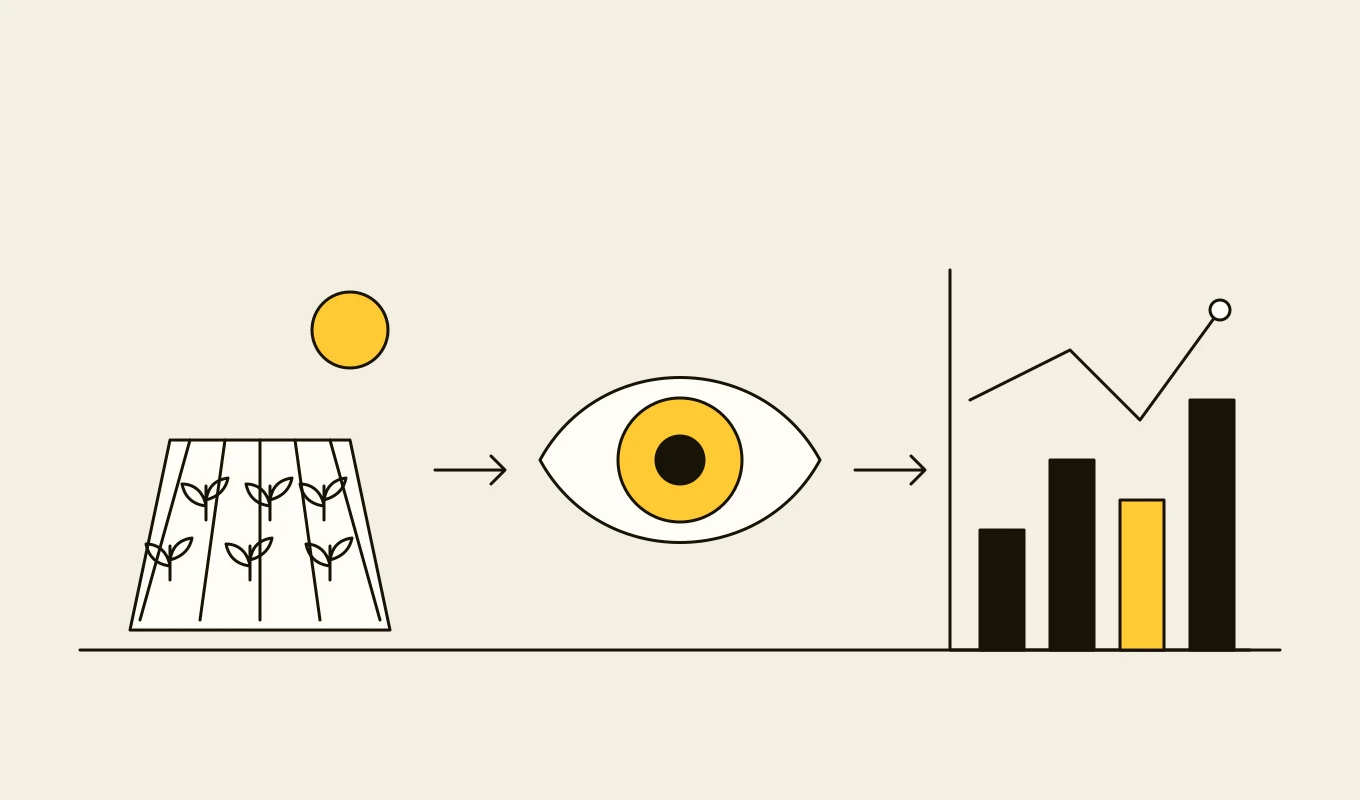
Checklist · Agriculture
Agri ERP and traceability requirements checklist
A requirements checklist for farm management, dealer, grain and field systems, with the records and geolocation that deforestation and food traceability rules ask for.- 01Eight requirement areas from the field register to compliance records.
- 02What plot-level geolocation and chain-of-custody records need to contain.
- 03Items for field apps that work without a mobile signal.
- 04Seven questions to put to any vendor or development partner.
Free download
Get it on screen in a few seconds.
What the system does, module by module.
- 01
Image capture and quality guidance
In-app guidance for taking useful photographs: framing, lighting, scale and multiple views, with rejection of unusable images before analysis. - 02
Disease and pest diagnosis
Classification of diseases, pests, nutrient deficiencies and weed pressure from photographs and context such as crop, growth stage and weather. - 03
Severity and extent scoring
Estimates of how much of the plant or canopy is affected, to support decisions on treatment thresholds. - 04
Confidence and differential diagnosis
Ranked possibilities with confidence, so the adviser sees alternatives and when the system is unsure. - 05
Offline inference
Compact models that run on the phone in the field, with fuller analysis in the cloud when coverage returns. - 06
Satellite and weather features
Vegetation indices from open satellite imagery, weather history and forecasts, and soil data, processed per field and season. - 07
Yield prediction
Field-level yield models trained on past harvests and updated through the season, with ranges that narrow as data arrives. - 08
Field validation and feedback
Comparison of predictions with adviser verdicts and harvest outcomes, with the corrections used for retraining. - 09
Recommendation links
Diagnoses linked to the product catalogue and registration rules, so a confirmed diagnosis becomes a compliant recommendation and quote.
Reference architecture.
Standards and interfaces
What we design against.
- BBCH growth stage scale
- Standard description of crop development stages, used as context for diagnosis and treatment timing.
- Open satellite data
- Freely available multispectral imagery such as Sentinel-2, used to derive vegetation indices for fields.
- Registration and label rules
- National registers that decide which treatments can be recommended for which crops and rates.
- Model evaluation practice
- Evaluation across regions, seasons and crop varieties, with calibration of confidence.
- ONNX and mobile inference runtimes
- Portable models and runtimes for on-device inference.
- Data protection and data ownership
- Rules for farmer data and agreements on how field data may be used and shared.
Data model
The core entities.
- Field and crop
- Boundary, crop, variety, sowing date, growth stage and management history.
- Photograph
- Image, location, time, capture guidance result and the observation it belongs to.
- Diagnosis
- Ranked classes with confidence, severity, model version and the adviser's verdict.
- Satellite and weather series
- Indices and weather values by field and date.
- Yield prediction
- Field, date of prediction, estimate with range and model version.
- Harvest outcome
- Actual yield by field, quality and conditions.
- Validation record
- Prediction, outcome, error and segment (region, crop, season).
When custom development is the right call.
Controls designed in, not added later.
Human confirmation
A diagnosis is a suggestion. An adviser confirms or corrects it before a treatment is recommended.Regional validation
Models are validated per region and crop, and shown only where tested, with confidence displayed.Grower data protection
Images and field data are used as agreed, with consent recorded and withdrawal respected.Model governance
Models are versioned and monitored for drift, and retrained under change control.Audit trail
Diagnoses, verdicts and recommendations are stored with the images and model versions.
From discovery to a system you run.
- 01
Crop and decision review
We agree the crops, problems and decisions to support, and review the images, field records and outcomes already available. - 02
Data collection and labelling
Photographs are collected with advisers across regions and seasons and labelled by experts, with disagreement recorded. - 03
Model development and field test
Models are trained and tested on unseen fields and regions, then trialled by advisers in the field. - 04
Integrate with advice and quotes
Confirmed diagnoses feed recommendations from the catalogue, with registration checks. - 05
Extend crops and add yield models
More crops and regions are added through the season cycle, with yield models validated against harvests.
Relevant work
Where to see our work.
Common questions.
- How accurate is diagnosis from a photograph?
- It depends on the crop, the problem and the photograph. We measure accuracy on your crops, regions and seasons, show confidence on each result and keep an adviser in the loop for every recommendation.
- Does it work without a mobile signal?
- Yes. A compact model runs on the phone in the field. A fuller analysis runs in the cloud when the phone is back in coverage.
- How do you predict yield?
- From satellite vegetation indices, weather, soil and management data for each field, trained on past harvests and updated through the season, with a range that narrows as the season progresses.
- Can a diagnosis lead directly to a product recommendation?
- Yes, through the catalogue. Recommendations are limited to registered products for the crop and rate, and an adviser approves the quote, as in the AgroPlatforma project.
- Who owns the models and the data?
- You do. The models, the images, the labels and the code stay yours.