AI/ML engineering · Oil and gas
Production forecasting and decline curve analysis with machine learning
We build production forecasting and decline curve analysis with machine learning for oil and gas operators: automated decline fits across hundreds of wells, probabilistic forecasts with P10, P50 and P90 outcomes, type curves for new wells, water cut and gas-oil ratio forecasts, and backtesting that shows how accurate each method has been. Engineers review and override, and the models and code are yours.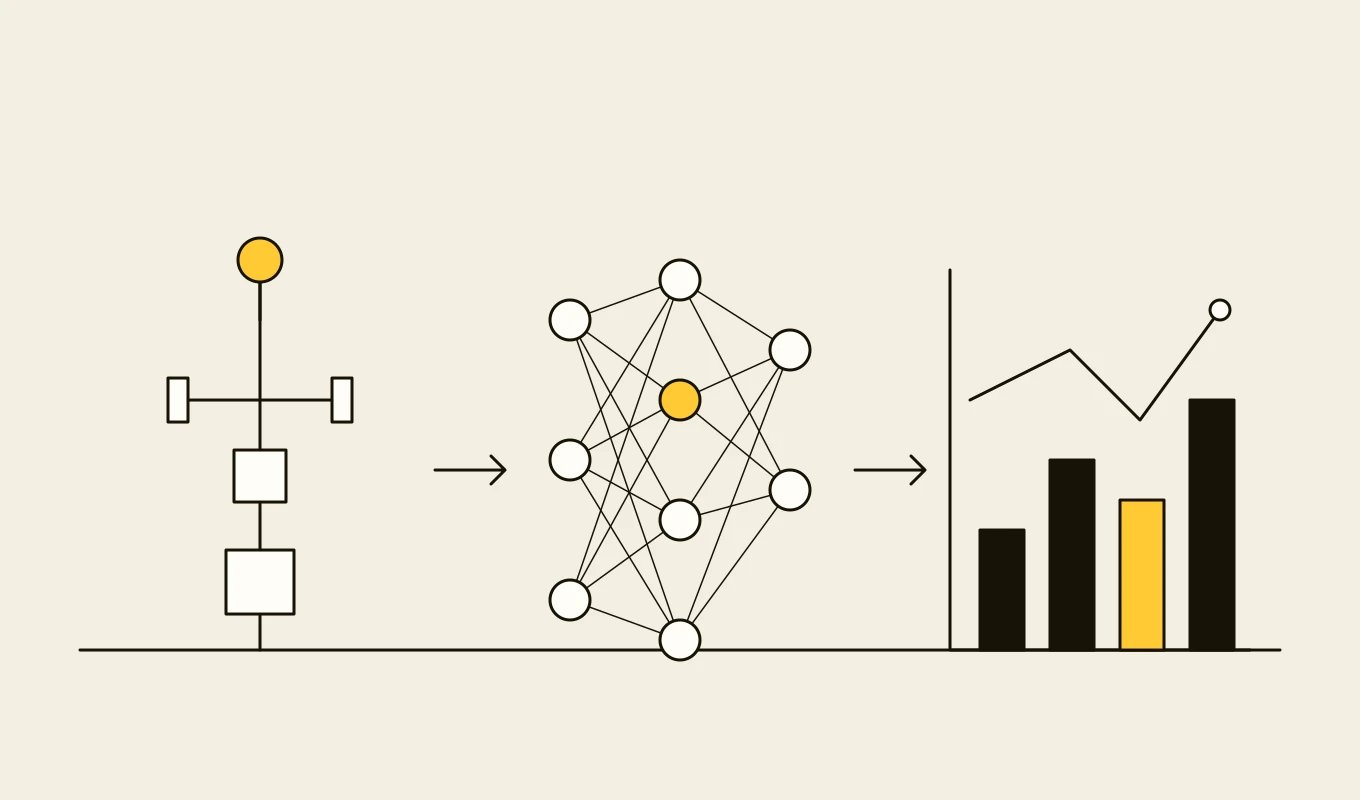
Requirements spec · Oil and gas
Upstream operations system requirements
A requirements specification you can adapt for an upstream production management or surveillance system: master data, acquisition, allocation, deferment, exceptions, reporting and the IT and OT boundary.- 01Eight requirement areas written as testable statements.
- 02Questions on data sources, quality flags and restatement rules.
- 03The IT and OT boundary items security teams ask about.
- 04Seven questions to put to any vendor or development partner.
Free download
Get it on screen in a few seconds.
What the system does, module by module.
- 01
Production data preparation
Cleaning of rate data: shut-ins, choke changes, interventions and data gaps are identified and handled explicitly so fits describe the well and not the noise. - 02
Automated decline fitting
Arps exponential, hyperbolic and harmonic fits, and modified or extended forms for unconventional wells, fitted automatically with the parameters and quality of each fit stored. - 03
Machine learning forecasts
Gradient boosting and sequence models that use rate history, pressure, completion and operating data to forecast where simple curves struggle, compared with the decline baseline. - 04
Probabilistic forecasting
Ranges, not single lines: P10, P50 and P90 forecasts from parameter and model uncertainty, ready for reserves and planning use. - 05
Type curves and analogues
Type curves by area, completion or formation, and forecasts for new wells based on analogue wells, with the selection of analogues visible. - 06
Water cut and gas-oil ratio
Forecasts of the other phases, with early warning of water breakthrough or gas coning and links to the surveillance system. - 07
Backtesting and accuracy
Hindcast tests that forecast the past from data available at the time, giving error measures by method, well type and horizon. - 08
Engineer review and overrides
A workspace to inspect fits, adjust parameters, choose a method and record why, with the previous forecast kept. - 09
Integration and reporting
Forecasts delivered to the production platform, budgeting and reserves processes, and standard reports by field, asset and category.
Reference architecture.
Standards and interfaces
What we design against.
- SPE Petroleum Resources Management System
- Classification and categorisation framework for reserves and resources, which probabilistic forecasts and reporting must align with.
- Arps and extended decline models
- Established empirical decline relationships and their extensions for tight and unconventional reservoirs.
- PRODML
- Production data exchange with source systems and partners.
- Model validation practice
- Hindcasting, out-of-sample testing and documented limits of use for forecasting models.
- OSDU data platform
- Where operators publish well and production data, the forecasting platform reads from and writes results back to it.
- Reserves audit expectations
- Documentation that auditors and regulators expect for the basis of a forecast.
Data model
The core entities.
- Well and completion
- Identifiers, formation, completion design, area and start date.
- Production series
- Daily or monthly rates by phase, with flags for shut-ins, events and data quality.
- Fit
- Method, parameters, fit window, quality measures and who or what produced it.
- Forecast
- Method and version, horizon, P10, P50 and P90 series and the data cut-off date.
- Type curve
- Population definition, curve, uncertainty and the wells included.
- Backtest result
- Method, origin date, horizon, error measures and the set of wells.
- Override
- Original forecast, adjusted forecast, reason and the engineer responsible.
When custom development is the right call.
Controls designed in, not added later.
Governed models
Models are versioned in a registry with documented training data and limits of use, and changes are approved.Engineer accountability
Forecasts used for reporting are reviewed by an engineer, and overrides keep the original and the reason.Data protection
Well and production data is confidential, with access by asset and partner agreement.Reproducibility
Each forecast can be reproduced from the data cut-off, model version and parameters stored with it.One-way data flow
Operational data is read into the platform with no path back to control systems.
From discovery to a system you run.
- 01
Data and forecast review
We review the production data, current forecasting methods and how forecasts are used, with reservoir, production and finance teams. - 02
Baseline and backtest framework
Automated decline fits and the backtesting framework are built first, so every later method is compared with the same yardstick. - 03
Machine learning and probabilistic methods
Machine learning models and probabilistic ranges are developed and compared with the baseline on past data. - 04
Pilot on one asset
Engineers use the platform on one asset alongside their usual tools, and differences are reviewed. - 05
Integrate and extend
Forecasts flow to production management and planning, and more assets and wells are added.
Relevant work
Where to see our work.
Common questions.
- Do machine learning forecasts replace decline curve analysis?
- No. Decline curves remain the baseline and the accepted basis for much reserves work. Machine learning adds short-term accuracy where wells behave unusually and gives a systematic way to test which method works best.
- How do you show that a forecast method is accurate?
- By backtesting: each method forecasts the past using only the data available at the time, and the errors are measured by well type and horizon. The results are shown with each forecast.
- Can the system produce P10, P50 and P90 forecasts?
- Yes. Ranges come from parameter uncertainty and model comparison, and are delivered in the form planning and reserves processes use.
- What about wells with little history?
- New wells are forecast from type curves and analogue wells, with the choice of analogues visible and open to engineer judgement, and the forecast updates as production data accumulates.
- Who owns the models and the code?
- You do. The models, the code and the data stay yours.